Analytics
Analytics shows how your community is doing: who plays, which modules work, and what sells. Open it from the sidebar.
Controls
Section titled “Controls”At the top of every tab:
- Server: All servers, or one game server.
- Period: 24h, 7d, 30d (the default) or 90d.
| Tab | Answers | Needs permission |
|---|---|---|
| Overview | Is my community growing? Where is the activity? | Read Events |
| Players | Who plays, how long, and what do they do? | Read Events |
| Shop | What sells, and who buys? | Manage Shop Listings |
| Modules | Which modules run, and which ones fail? | Read Events |
You only see the tabs your permissions allow.
Overview
Section titled “Overview”The big picture for your whole community.
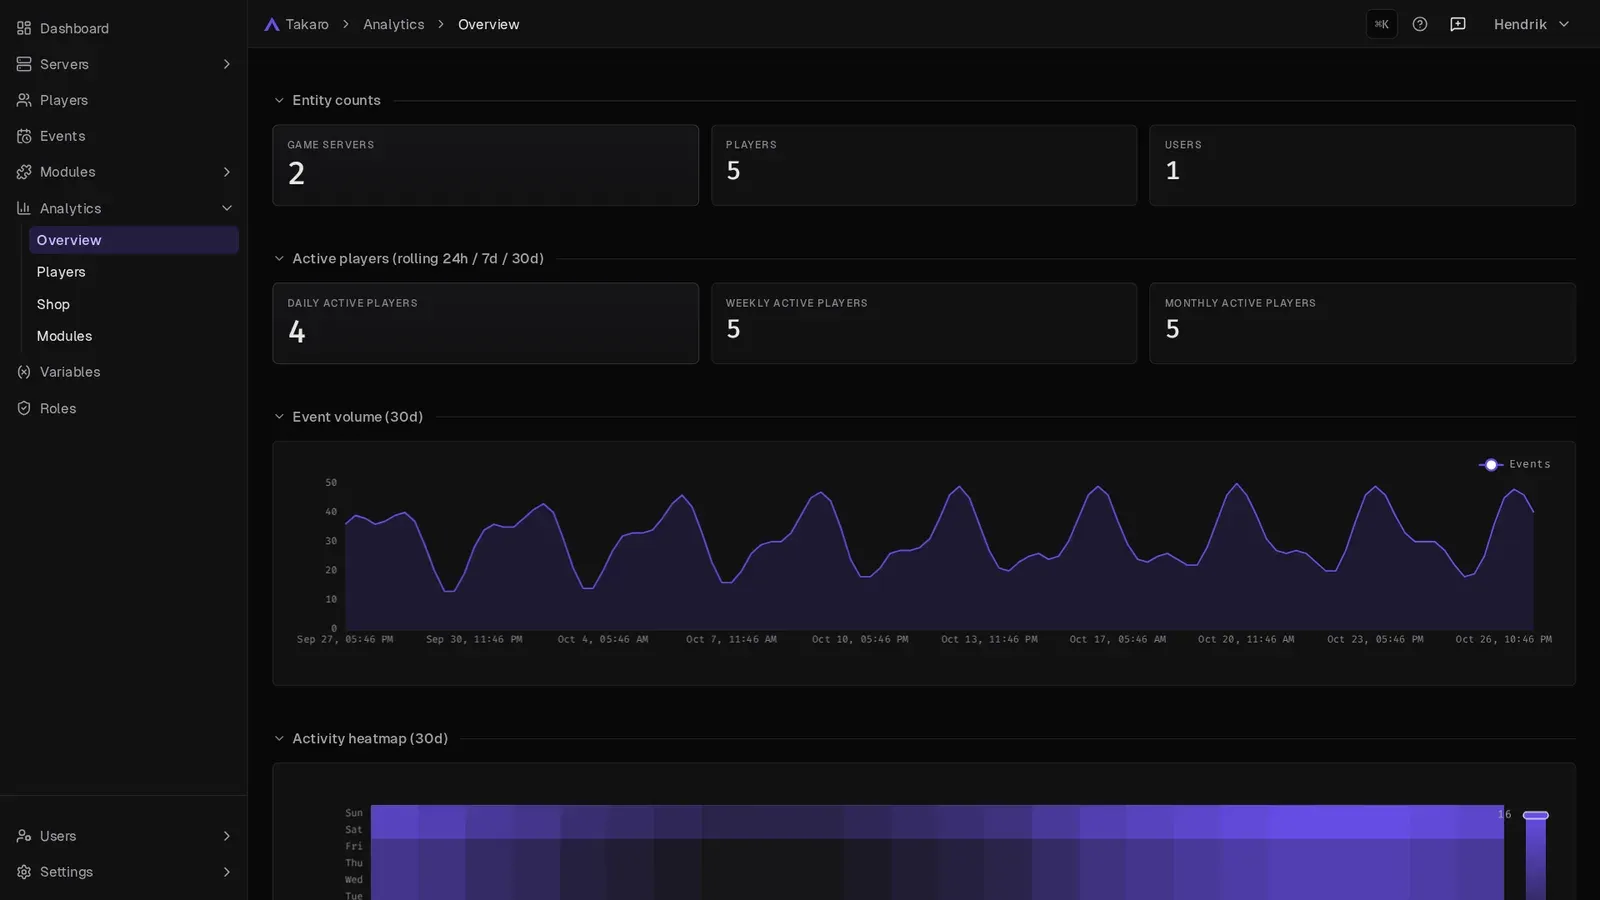
- Daily, Weekly and Monthly active players.
- Entity counts: how many players, game servers, users and events you have.
- Event volume over time, and an Activity heatmap that shows your busiest hours.
- Top event types, Top servers by event volume and Top modules by execution volume.
Use it to spot growth or decline, and to plan events or restarts around your quiet hours.
Players
Section titled “Players”How your players behave.
- Player KPIs: New players, Returning players, Peak concurrent and Avg session.
- Players online over time and Session length distribution.
- Players by country.
- Playtime leaderboard and Kill leaderboard.
- Activity mix, Daily player events and a Chat activity heatmap.
- Currency flow: how much currency was Added and Deducted. See Economy.
- Moderation timeseries: Bans and Unbans over time.
- Ping health: typical (p50 ms) and worst-case (p95 ms) ping.
Use it to see if new players stick around, who your most active players are, and whether lag is a problem.
How your shop is selling.
- Shop KPIs: Total revenue, Total orders, Avg order value and Unique buyers.
- Order volume over time and the Order status mix (Paid, Completed, Canceled).
- Top listings by revenue and Revenue by category.
- Top buyers and Customer segments: New, Returning and Frequent buyers.
- Shop revenue heatmap: when players buy.
- Dead stock listings: listings that haven’t sold in the last 30 days.
- Recent orders.
Use it to adjust prices, drop listings nobody buys, and time your sales.
Modules
Section titled “Modules”How healthy your modules are.
- Module KPIs: Total runs, Failures, Fail rate and Items tracked.
- Module runs by type.
- Top modules by execution volume.
- Module health radar: scores each module on success rates for commands, hooks, cron jobs and shop actions, Relative volume and Player reach.
- Failing module items: the commands, hooks and cron jobs that fail most.
Use it to find broken modules before your players complain. To dig into a failure, see Debugging modules.
Per-server statistics
Section titled “Per-server statistics”For a quick look at one server, open it in the sidebar and click Statistics. It shows Players online, Currency timeseries and Players by country for that server. See Servers.